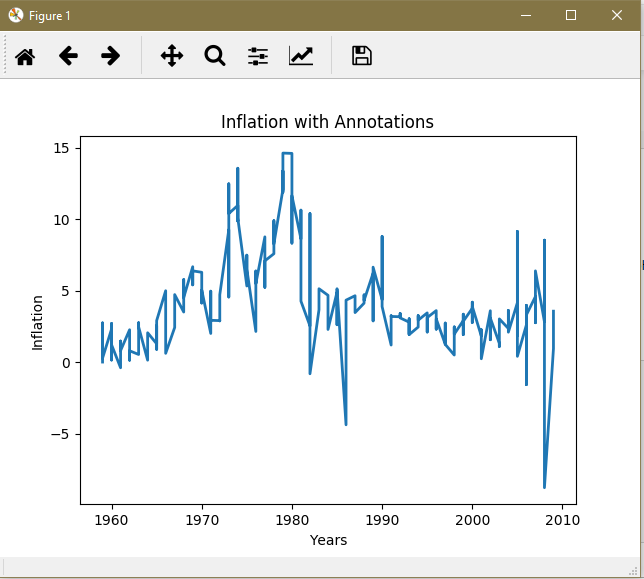
我想弄清楚如何在图形窗口中自动注释最大值。我知道您可以通过手动输入 x、y 坐标来使用 .annotate() 方法注释您想要的任何点来执行此操作,但我希望注释是自动的,或者找到最大点自己。
到目前为止,这是我的代码:
import matplotlib.pyplot as plt
import numpy as np
import pandas as pd
from pandas import Series, DataFrame

df = pd.read_csv('macrodata.csv') #Read csv file into dataframe
years = df['year'] #Get years column
infl = df['infl'] #Get inflation rate column

fig10 = plt.figure()
win = fig10.add_subplot(1,1,1)
fig10 = plt.plot(years, infl, lw = 2)

fig10 = plt.xlabel("Years")
fig10 = plt.ylabel("Inflation")
fig10 = plt.title("Inflation with Annotations")

最佳答案
如果 x 和 y 是要绘制的数组,您可以通过
xmax = x[numpy.argmax(y)]
ymax = y.max()
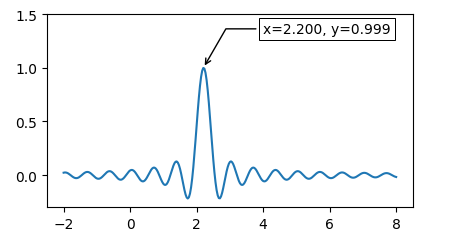
这可以合并到一个函数中,您可以简单地用您的数据调用该函数。
import matplotlib.pyplot as plt
import numpy as np

x = np.linspace(-2,8, num=301)
y = np.sinc((x-2.21)*3)


fig, ax = plt.subplots()
ax.plot(x,y)

def annot_max(x,y, ax=None):
    xmax = x[np.argmax(y)]
    ymax = y.max()
    text= "x={:.3f}, y={:.3f}".format(xmax, ymax)
    if not ax:
        ax=plt.gca()
    bbox_props = dict(boxstyle="square,pad=0.3", fc="w", ec="k", lw=0.72)
    arrowprops=dict(arrowstyle="->",connectionstyle="angle,angleA=0,angleB=60")
    kw = dict(xycoords='data',textcoords="axes fraction",
              arrowprops=arrowprops, bbox=bbox_props, ha="right", va="top")
    ax.annotate(text, xy=(xmax, ymax), xytext=(0.94,0.96), **kw)

annot_max(x,y)


ax.set_ylim(-0.3,1.5)
plt.show()
关于python - 如何在pyplot中自动标注最大值,我们在Stack Overflow上找到一个类似的问题: https://stackoverflow.com/questions/43374920/
