我正在尝试使用词法分析器,我发现在程序的一部分中从 while 循环切换到 if 语句和 do-while 循环会导致代码速度提高约 20%,这看起来很疯狂.我将编译器生成的代码中的差异与这些程序集片段隔离开来。有谁知道为什么快速代码更快?
在程序集中,'edi' 是当前文本位置,'ebx' 是文本结尾,'isAlpha' 是一个查找表,如果字符是字母则为 1,否则为 0。
慢代码:
slow_loop:
00401897  cmp   edi,ebx
00401899  je    slow_done (4018AAh)
0040189B  movzx eax,byte ptr [edi]
0040189E  cmp   byte ptr isAlpha (4533E0h)[eax],0
004018A5  je    slow_done (4018AAh)
004018A7  inc   edi
004018A8  jmp   slow_loop (401897h)
slow_done:
快速代码:
fast_loop:
0040193D  inc   edi
0040193E  cmp   edi,ebx
00401940  je    fast_done (40194Eh)
00401942  movzx eax,byte ptr [edi]
00401945  cmp   byte ptr isAlpha (4533E0h)[eax],0
0040194C  jne   fast_loop (40193Dh)
fast_done:
如果我仅针对仅包含字母“a”的 1 兆字节文本运行这些汇编代码片段,则快速代码的速度将提高 30%。我的猜测是由于分支预测错误,慢代码很慢,但我认为在循环中这将是一次性成本。
这是我用来测试两个片段的程序:
#include <Windows.h>
#include <string>
#include <iostream>

int main( int argc, char* argv[] )
{
    static char isAlpha[256];
    for ( int i = 0; i < sizeof( isAlpha ); ++i )
        isAlpha[i] = isalpha( i ) ? 1 : 0;

    std::string test( 1024*1024, 'a' );

    const char* start = test.c_str();
    const char* limit = test.c_str() + test.size();

    DWORD slowStart = GetTickCount();
    for ( int i = 0; i < 10000; ++i )
    {
        __asm
        {
            mov edi, start
            mov ebx, limit

            inc edi

        slow_loop:
            cmp   edi,ebx
            je    slow_done
            movzx eax,byte ptr [edi]
            cmp   byte ptr isAlpha [eax],0
            je    slow_done
            inc   edi
            jmp   slow_loop

        slow_done:
        }
    }
    DWORD slowEnd = GetTickCount();
    std::cout << "slow in " << ( slowEnd - slowStart ) << " ticks" << std::endl;

    DWORD fastStart = GetTickCount();
    for ( int i = 0; i < 10000; ++i )
    {
        __asm
        {
            mov edi, start
            mov ebx, limit

        fast_loop:
            inc   edi
            cmp   edi,ebx
            je    fast_done
            movzx eax,byte ptr [edi]
            cmp   byte ptr isAlpha [eax],0
            jne   fast_loop

        fast_done:
        }
    }
    DWORD fastEnd = GetTickCount();
    std::cout << "fast in " << ( fastEnd - fastStart ) << " ticks" << std::endl;

    return 0;
}
测试程序的输出是
slow in 8455 ticks
fast in 5694 ticks
最佳答案
抱歉,我无法在 GCC (linux) 上完全重现您的代码,但我有一些结果,我认为主要思想已保存在我的代码中。
英特尔提供了一个分析代码片段性能的工具:http://software.intel.com/en-us/articles/intel-architecture-code-analyzer/ (英特尔 IACA)。它可以免费下载和测试。
在我的实验中,报告慢循环:
Intel(R) Architecture Code Analyzer Version - 2.0.1
Analyzed File - ./l2_i
Binary Format - 32Bit
Architecture  - SNB
Analysis Type - Throughput

Throughput Analysis Report
--------------------------
Block Throughput: 3.05 Cycles       Throughput Bottleneck: Port5

Port Binding In Cycles Per Iteration:
-------------------------------------------------------------------------
|  Port  |  0   -  DV  |  1   |  2   -  D   |  3   -  D   |  4   |  5   |
-------------------------------------------------------------------------
| Cycles | 0.5    0.0  | 0.5  | 1.0    1.0  | 1.0    1.0  | 0.0  | 3.0  |
-------------------------------------------------------------------------

N - port number or number of cycles resource conflict caused delay, DV - Divide
D - Data fetch pipe (on ports 2 and 3), CP - on a critical path
F - Macro Fusion with the previous instruction occurred

| Num Of |              Ports pressure in cycles               |    |
|  Uops  |  0  - DV  |  1  |  2  -  D  |  3  -  D  |  4  |  5  |    |
---------------------------------------------------------------------
|   1    |           |     |           |           |     | 1.0 | CP | cmp edi,
|   0F   |           |     |           |           |     |     |    | jz 0xb
|   1    |           |     | 1.0   1.0 |           |     |     |    | movzx ebx
|   2    |           |     |           | 1.0   1.0 |     | 1.0 | CP | cmp cl, b
|   0F   |           |     |           |           |     |     |    | jz 0x3
|   1    | 0.5       | 0.5 |           |           |     |     |    | inc edi
|   1    |           |     |           |           |     | 1.0 | CP | jmp 0xfff
对于快速循环:
Throughput Analysis Report
--------------------------
Block Throughput: 2.00 Cycles       Throughput Bottleneck: Port5

Port Binding In Cycles Per Iteration:
-------------------------------------------------------------------------
|  Port  |  0   -  DV  |  1   |  2   -  D   |  3   -  D   |  4   |  5   |
-------------------------------------------------------------------------
| Cycles | 0.5    0.0  | 0.5  | 1.0    1.0  | 1.0    1.0  | 0.0  | 2.0  |
-------------------------------------------------------------------------

N - port number or number of cycles resource conflict caused delay, DV - Divide
D - Data fetch pipe (on ports 2 and 3), CP - on a critical path
F - Macro Fusion with the previous instruction occurred

| Num Of |              Ports pressure in cycles               |    |
|  Uops  |  0  - DV  |  1  |  2  -  D  |  3  -  D  |  4  |  5  |    |
---------------------------------------------------------------------
|   1    | 0.5       | 0.5 |           |           |     |     |    | inc edi
|   1    |           |     |           |           |     | 1.0 | CP | cmp edi,
|   0F   |           |     |           |           |     |     |    | jz 0x8
|   1    |           |     | 1.0   1.0 |           |     |     |    | movzx ebx
|   2    |           |     |           | 1.0   1.0 |     | 1.0 | CP | cmp cl, b
|   0F   |           |     |           |           |     |     |    | jnz 0xfff
所以在慢循环中,JMP 是关键路径中的额外指令。所有 cmp+jz/jnz 对都被合并(宏融合)成单个 u-op。 在我的代码实现中,关键资源是 Port5,它可以执行 ALU+JMP(它是唯一具有 JMP 能力的端口)。
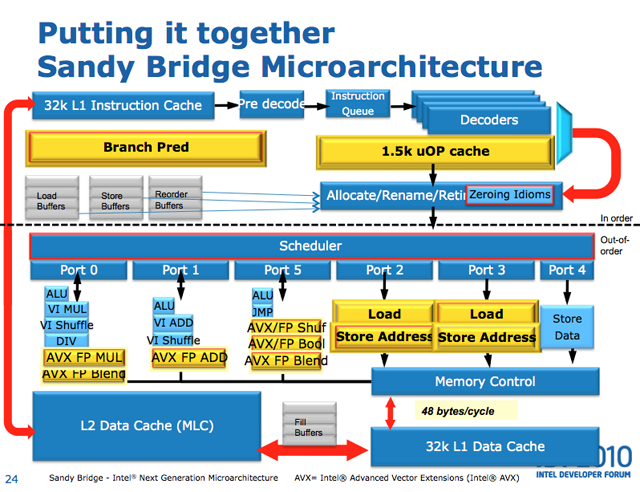
PS:如果有人不知道端口在哪里,有图片first second ;和文章:rwt
PPS:IACA 有一些限制;它仅对 CPU(执行单元)的一部分进行建模,并且不考虑缓存未命中、分支错误预测、不同的惩罚、频率/功率更改、操作系统中断、执行单元的超线程争用和许多其他影响。但它是有用的工具,因为它可以让您快速了解现代英特尔 CPU 最内部的内核。而且它只适用于内部循环(就像这个问题中的循环一样)。
关于c++ - 为什么这个汇编代码更快?,我们在Stack Overflow上找到一个类似的问题: https://stackoverflow.com/questions/11243015/