1.我的条形图有一个系列。
2.在系列中有 10 个值。
3.显示图表时,它有 10 个柱,但所有柱的颜色都相同
4.如何绘制不同颜色的条形图?
我试过了,但是不行
class MyBarRenderer extends BarRenderer<MyBarFormatter> {
    public MyBarRenderer(XYPlot plot) {
        super(plot);
    }

    protected BarFormatter getFormatter(int index, XYSeries series) {
        //return getFormatter(series);
        if(index % 2 == 1) {
            return new MyBarFormatter(Color.BLUE, Color.TRANSPARENT);
        } else {
            return new MyBarFormatter(Color.RED, Color.TRANSPARENT);
        }
    }
}
最佳答案
我的代码看起来与您的几乎相同,并且对我有效。这是我的其余代码:
class MyBarFormatter extends BarFormatter
{
    public MyBarFormatter(int fillColor, int borderColor)
    {
        super(fillColor, borderColor);
    }

    @Override public Class<? extends SeriesRenderer> getRendererClass()
    {
        return MyBarRenderer.class;
    }

    @Override public SeriesRenderer getRendererInstance(XYPlot plot)
    {
        return new MyBarRenderer(plot);
    }
}

class MyBarRenderer extends BarRenderer<MyBarFormatter>
{
    public MyBarRenderer(XYPlot plot)
    {
        super(plot);
    }

    public MyBarFormatter getFormatter(int index, XYSeries series)
    {
        // return getFormatter(series);
        if(index % 2 == 1)
        {
            return new MyBarFormatter(Color.BLUE, Color.TRANSPARENT);
        }
        else
        {
            return new MyBarFormatter(Color.RED, Color.TRANSPARENT);
        }
    }
}
为了使用这两个类,我调用了以下代码:
// Create an array of y-values to plot:
Number[] values = { 380, 1433, 1965, 3200, 3651, 3215, 3217, 1000, 500, 4300, 3000, 2100 };

// Turn the above array into XYSeries':
XYSeries series1 = new SimpleXYSeries(Arrays.asList(values), SimpleXYSeries.ArrayFormat.Y_VALS_ONLY, "Series1");

// Add a new series to the xyplot:
MyBarFormatter formatter1 = new MyBarFormatter(Color.argb(200, 100, 150, 100), Color.LTGRAY);
mySimpleXYPlot.addSeries(series1, formatter1);

// Give each bar a fixed width
MyBarRenderer renderer = ((MyBarRenderer) mySimpleXYPlot.getRenderer(MyBarRenderer.class));
renderer.setBarWidthStyle(BarRenderer.BarWidthStyle.FIXED_WIDTH);
renderer.setBarWidth(50);
这是它的样子,在 2 种不同颜色之间交替:
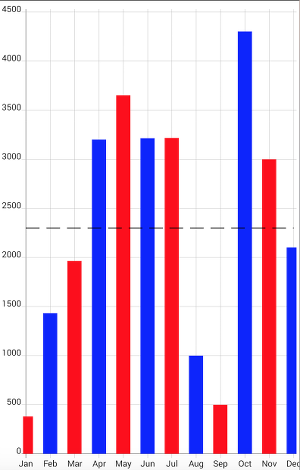
此外,要添加水平虚线:
YValueMarker yValueMarker = new YValueMarker(2300, "", new XPositionMetric(PixelUtils.dpToPix(0), XLayoutStyle.ABSOLUTE_FROM_RIGHT), Color.BLACK, Color.BLACK);

DashPathEffect dashPathEffect = new DashPathEffect(new float[] { PixelUtils.dpToPix(16), PixelUtils.dpToPix(8) }, 0);

yValueMarker.getLinePaint().setPathEffect(dashPathEffect);

yValueMarker.getLinePaint().setStrokeWidth(PixelUtils.dpToPix(1));

yValueMarker.getLinePaint().setColor(Color.BLACK);

addMarker(yValueMarker);
关于android - 如何在 androidplot 条形图中绘制不同颜色的条形图?,我们在Stack Overflow上找到一个类似的问题: https://stackoverflow.com/questions/21471406/