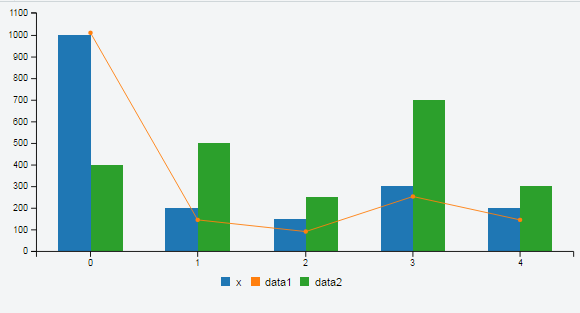
我使用 C3.JS 创建了一个图表。它有条形图和折线图,如下所示
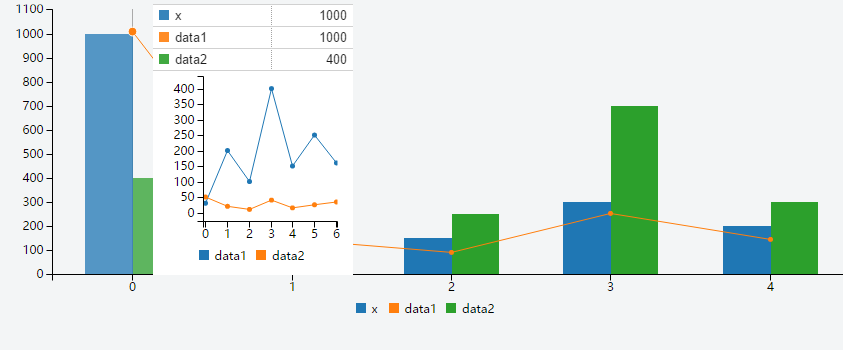
图表工作正常,但我有一个要求,我需要在工具提示中显示一个折线图以及其他数据点。
折线图来了,但缺少其他数据点(x,data1,data2)。此外,默认情况下,工具提示应仅在鼠标单击时出现,而不是鼠标悬停在页面加载时,工具提示应出现在最后一个栏中。
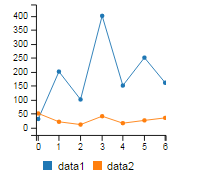
当前我的工具提示仅显示如下所示的折线图,没有其他数据点(x,data1,data2)
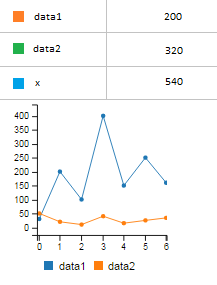
但我希望我的工具提示如下所示
我的代码如下
谁能帮我解决这个问题
function generateGraph(tooltip, data1, data2) {
    // if the data is same as before don't regenrate the graph - this avoids flicker
   if (tooltip.data1 &&
       (tooltip.data1.name === data1.name) && (tooltip.data1.value === data1.value) &&
       (tooltip.data2.name === data2.name) && (tooltip.data2.value === data2.value))
       return;

    tooltip.data1 = data1;
    tooltip.data2 = data2;

    // remove the existing chart
    if (tooltip.chart) {
        tooltip.chart = tooltip.chart.destroy();
        tooltip.selectAll('*').remove();
    }

    // create new chart
    tooltip.chart = c3.generate({
        bindto: tooltip,
          padding: {
          right: 15
            },
        size: {
            width: 200,
            height: 200
        },
        data: {
        columns: [
                ['data1', 30, 200, 100, 400, 150, 250, 160],
                ['data2', 50, 20, 10, 40, 15, 25, 34]
            ]
        },
        tooltip: {
            show: false
          }
    });

    // creating a chart on an element sets its position attribute to relative
    // reset it to absolute (the tooltip was absolute originally) for proper positioning
    tooltip.style('position', 'absolute');
    tooltip.style('background-color', 'white');
}

var chart = c3.generate({
    data: {
        columns: [
            ['x', 1000, 200, 150, 300, 200],
            ['data1', 1000, 200, 150, 300, 200],
            ['data2', 400, 500, 250, 700, 300], ],

            axes: {
                             'data1': 'y2'
                            },
            type: 'bar',
            types: {
              'data1': 'line'
            }
    },
    tooltip: {
        contents: function (d, defaultTitleFormat, defaultValueFormat, color) {
            // this creates a chart inside the tooltips
            var content = generateGraph(this.tooltip, d[0], d[1])
            // we don't return anything - see .html function below
            }
    }
});

// MONKEY PATCHING (MAY break if library updates change the code that sets tooltip content)
// we override the html function for the tooltip to not do anything (since we've already created the tooltip content inside it)
chart.internal.tooltip.html = function () {
    // this needs to return the tooltip - it's used for positioning the tooltip
    return chart.internal.tooltip;
}
最佳答案
现场演示: http://jsfiddle.net/blackmiaool/y7Lhej4m/
我没有覆盖 tooltip 的 .html 函数,而是使用 contents 和 css 来自定义 tooltip。
js:
contents: function (d, defaultTitleFormat, defaultValueFormat, color) {
    generateGraph(this.tooltip, d[0], d[1]);
    var tip = this.tooltip[0][0].querySelector(".c3-tooltip");//find previous tooltip
    if (tip) {
        tip.parentElement.removeChild(tip);//remove it
    }
    return this.getTooltipContent.apply(this, arguments) + this.tooltip.html();//concat default tooltip and  customized one
}
CSS:
.c3-tooltip-container {
    max-height: none !important;
}

.c3-tooltip {
    box-shadow: none;
    width: 100%;
}

.c3-tooltip tr {
    border-left: none !important;
    border-right: none !important;
}

.c3-tooltip td.name {
    border-left: none !important;
}

.c3-tooltip tr:first-child {
    display: none;
}

.c3-tooltip-container .c3-chart-line {
    opacity: 1 !important;
}
关于javascript - 为 C3JS 定制的工具提示,我们在Stack Overflow上找到一个类似的问题: https://stackoverflow.com/questions/43042156/